


[minipost] Capturing bidirectional traffic of virtual machine (VMs) on vmWare ESX 6.x
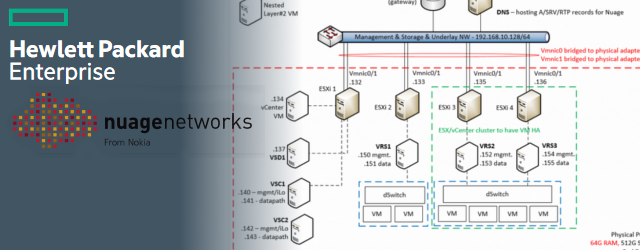
Here I was getting a trouble with communication between an ESX virtual machine and the nearby switch (Nuage/DCN controller VM talking with a VTEP switch if someone is interested) and because that switch was direct destination of the control plane packets (OVSDB over TCP) I was not having much success creating a mirroring interface on the switch. So I learned how to capture a specific virtual machine traffic directly on the ESXi host’s SSH console and to not forget that, I will document this here.
Contents of Article
Step 1 – enable SSH to the ESX host
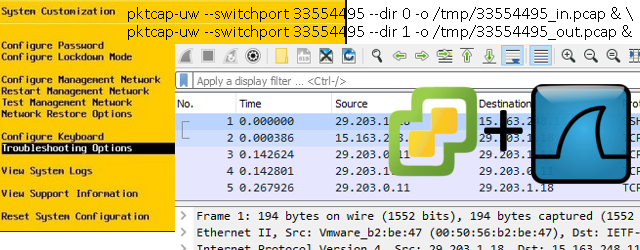
In most cases this is not running by default, so go to the ESXi server direct terminal or iLo and via “F2″enter system customization and enter troubleshooting section:

Right behind this menu should be “SSH Enable” option, and you simply hit that with enter 😉
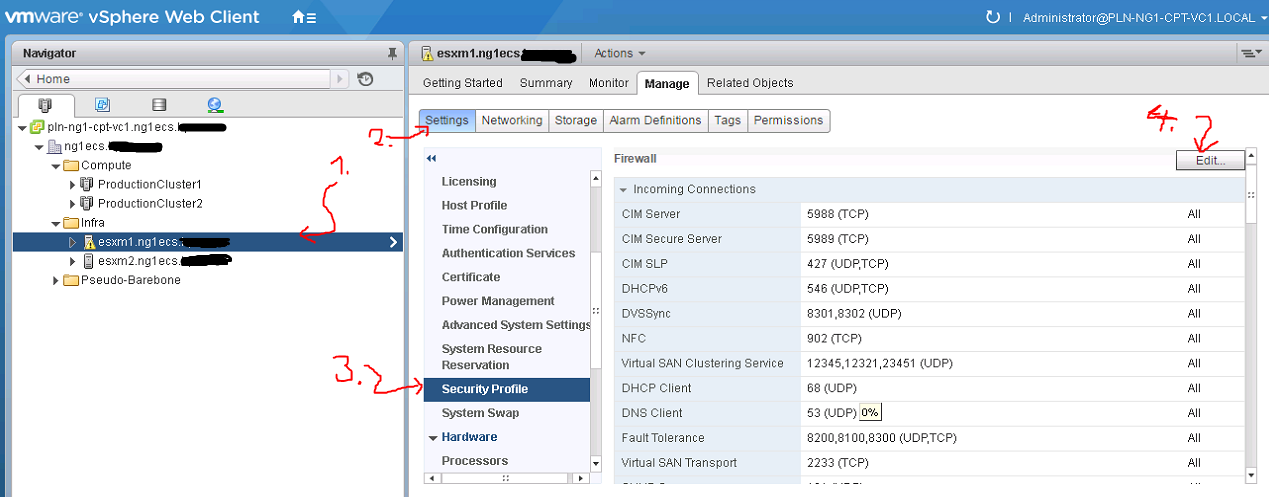
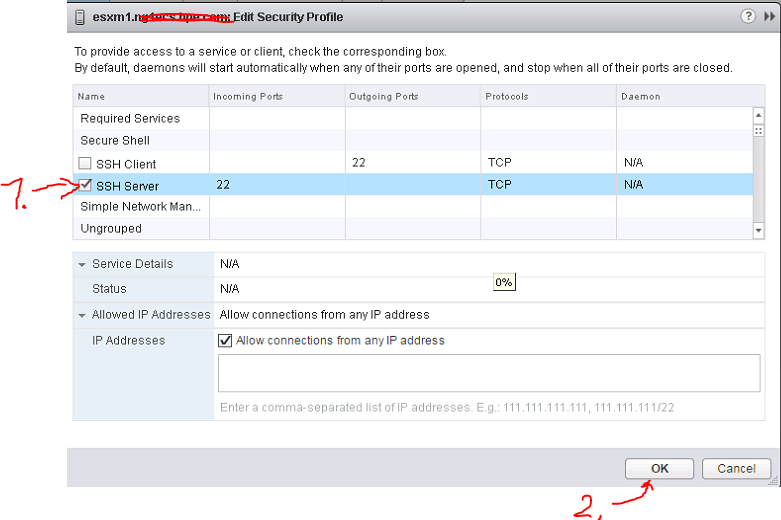
ALTERNATIVE: If you have vCenter deployed, you can use its GUI to enable SSH on a specific host like this:
Step 2 – locating switchport ID
My virtual machine was called “DCN4.0R5_VSC1” and was simply connected to logical vswitch0 in ESX hosts operation. However what we need to find out is the numerical id of the specific switch port. To do this we have two possible paths, first options is to check “net-stats -l” in ESXi hosts SSH console like this:
[root@esxm1:~] net-stats -l
PortNum          Type SubType SwitchName       MACAddress         ClientName
33554495            5       7 vSwitch0         00:50:56:b2:20:bb  DCN4.0R5_VSC1
33554496            5       7 vSwitch0         00:50:56:b2:1f:cd  DCN4.0R5_VSC1
ALTERNATIVE if you do not know your VMs name or you would like to know what portgroup it is connected to, you can use “esxcli” commands like this:
[root@esxm1:~] esxcli network vm list
World ID  Name              Num Ports  Networks
--------  ----------------  ---------  --------------------------------------
 2615418  DCN4.0R5_VSC1             2  VPC SDN Underlay, Network Devices Mgmt
And then details of the port of your VM with:
[root@esxm1:~] esxcli network vm port list -w 2615418
   Port ID: 33554495
   vSwitch: vSwitch0
   Portgroup: VPC SDN Underlay
   DVPort ID:
   MAC Address: 00:50:56:b2:20:bb
   IP Address: 0.0.0.0
   Team Uplink: vmnic2
   Uplink Port ID: 33554437
   Active Filters:

   Port ID: 33554496
   vSwitch: vSwitch0
   Portgroup: Network Devices Mgmt
   DVPort ID:
   MAC Address: 00:50:56:b2:1f:cd
   IP Address: 0.0.0.0
   Team Uplink: vmnic2
   Uplink Port ID: 33554437
   Active Filters:
Step 3 – running the capture
The funny part is that on ESX there exists a command pktcap-uw to capture traffic on a specific VM’s interfaces, for example for the VMs I was targeting I would run this command (with traffic captured going to /tmp/ ):
pktcap-uw --switchport 33554495 -o /tmp/33554495.pcap
However this command is by default a unidirectional and we have to trick our way around to get bidirectional traffic. There is a selector switch in this commend “–dir 1” that captures input packets and “–dir 0” that captures output packets and what we can do this by using the good old “&” run two captures in parallel capturing both directions into separate files like this:
pktcap-uw --switchport 33554495 --dir 0 -o /tmp/33554495_in.pcap & \
pktcap-uw --switchport 33554495 --dir 1 -o /tmp/33554495_out.pcap &
The above will start two captures in the background. To stop this capture, you can either list the processes using “lsof” command and then stop them by killing them using “kill <number>” manually, or using this great trick by parsing all kill processes from lsof to the kill command using awk:
kill $(lsof |grep pktcap-uw |awk '{print $1}'| sort -u)
The result isthat you will have two pcap files, one for each direction, but how to put these together for a coherent capture file? Next step is for that 😉
Step 4 – Merging two unidirectional pcap files to one bidirectional
Actually since both pcap files were captured on one system (with one internal clock), the pcap files have a synchronized timestamp marking packets, therefore a simple merge with utility called “mergecap“, which is part of wireshark installation on both linux and windows, is all that we need. For example:
Windows mergecap example:
C:\Program Files\Wireshark>mergecap.exe -w C:\Users\havrila\Downloads\33554495_merged.pcap C:\Users\havrila\Downloads\33554495_in.pcap C:\Users\havrila\Downloads\33554495_out.pcap
Linux ergecap example:
$ mergecap -w ./33554495_merged.pcap ./33554495_in.pcap ./33554495_out.pcap
And that’s it, you can now open 33554495_merged.pcap in wireshark and see your ESX VMs traffic as a normal bidirection traffic capture. Enjoy.
PS: If you wonder about timestamps inside pcap files, or in the future would have two captured files from two systems that do not have clocks synchronized and would want to merge files like that, have a look on capinfos and editcap utilities from wireshark. You can offset timing with them very easily (editcap -t <offset> A.pcap B.pcap).
Nice article! Looks like there is now a bi-directional capture option (–dir 2), not sure if it was released recently but this is from 6.7 U2.
–dir (for –switchport, –vmk, –uplink, –fcport)
The direction of flow, with respect to the vswitch:
0- Input: to vswitch (Default), 1- Output: from vswitch, 2- Input and Output